Case studies

The numbers behind the work.

Real results from Instagram and TikTok accounts we have grown, with the analytics screenshots to prove it.

231 million views in 30 days on a single account

Platform
Instagram
Timeframe
30 days (May 30 – Jun 28)
Services
Viral Content, Organic Growth
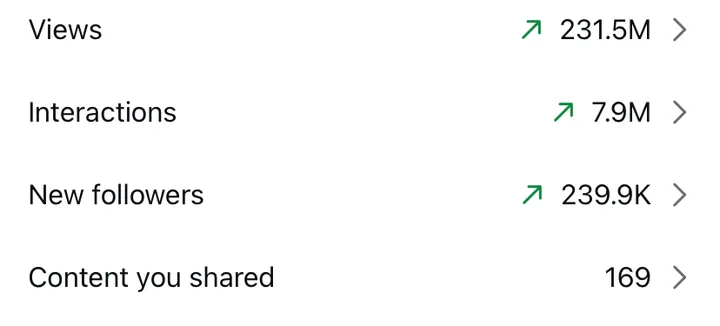
231.5M
Views in 30 days
87.5M
Accounts reached, up 91.4%
7.9M
Interactions
239.9K
New followers

The starting point

The account was already reaching about 45.7 million accounts a month, the point where most accounts plateau. The goal was to keep growing at that scale without the content going stale.

What the data shows

  • 92.1% of views came from non-followers
  • Reels drove 98.5% of all views
  • Reach nearly doubled compared with the previous 30 days
  • 169 pieces of content shared in the month

What we did

  • Built original, repeatable concepts for the account instead of copying trends
  • Published 169 pieces of content in the month, almost all of them Reels
  • Engineered every hook and opening second to reach people who didn't follow yet
  • Reviewed performance weekly and doubled down on the concepts that traveled furthest

Screenshots from Instagram
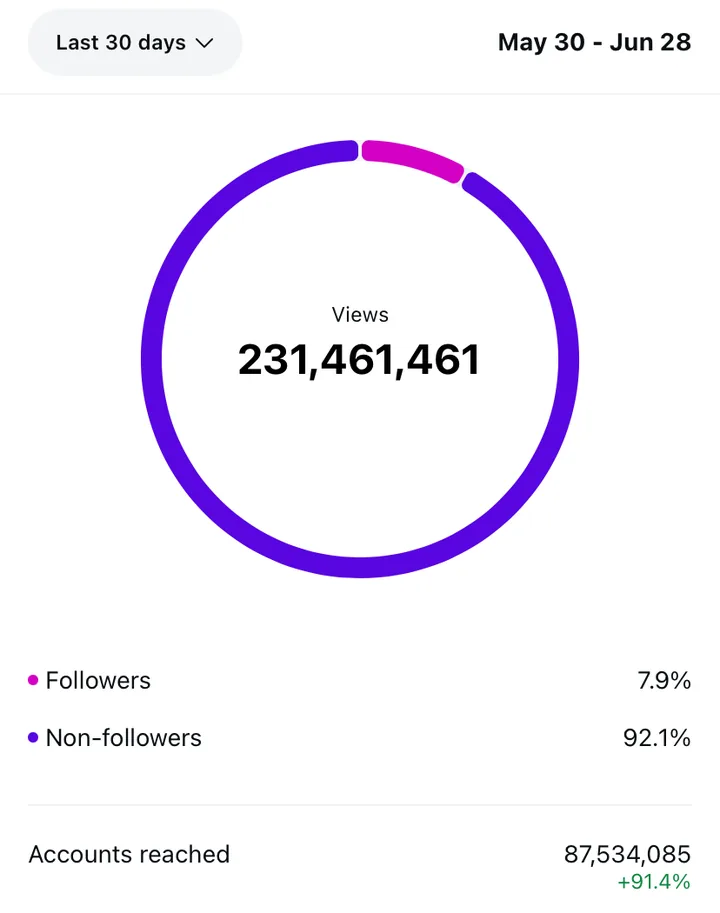
Instagram Insights: 231,461,461 views and 87,534,085 accounts reached, May 30 to Jun 28
Instagram professional dashboard: 231.5M views, 7.9M interactions, 239.9K new followers, 169 pieces of content

Source: Instagram Insights and professional dashboard, May 30 – Jun 28
18.8 million TikTok views in 7 days

Platform
TikTok
Timeframe
7 days (Oct 5 – Oct 11)
Services
Viral Content, Organic Growth
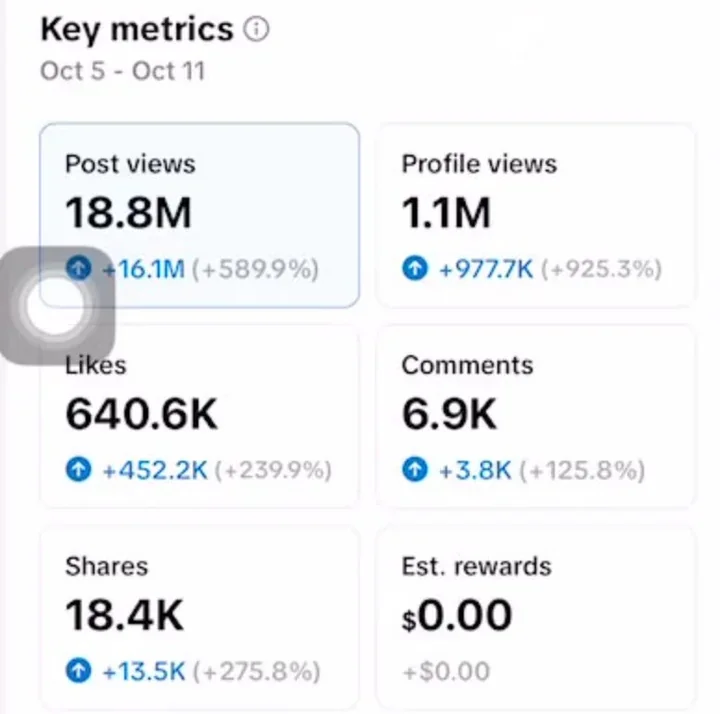
18.8M
Post views, up 589.9% week on week
1.1M
Profile views, up 925.3%
640.6K
Likes, up 239.9%
18.4K
Shares, up 275.8%

The starting point

The account only started gaining traction in August. The week before this one, it had about 2.7 million post views and roughly 120,000 profile views. The goal was to turn that early momentum into a breakout week.

What the data shows

  • 57% of the account's views for the whole year came in this single week: 18.8M of 32.8M
  • Views grew almost 7x in one week, from about 2.7M to 18.8M
  • Profile views grew even faster than views (+925%), so viewers wanted to see more of the account
  • About 1 in 29 viewers liked a video and shares nearly quadrupled, the signals TikTok uses to push content further
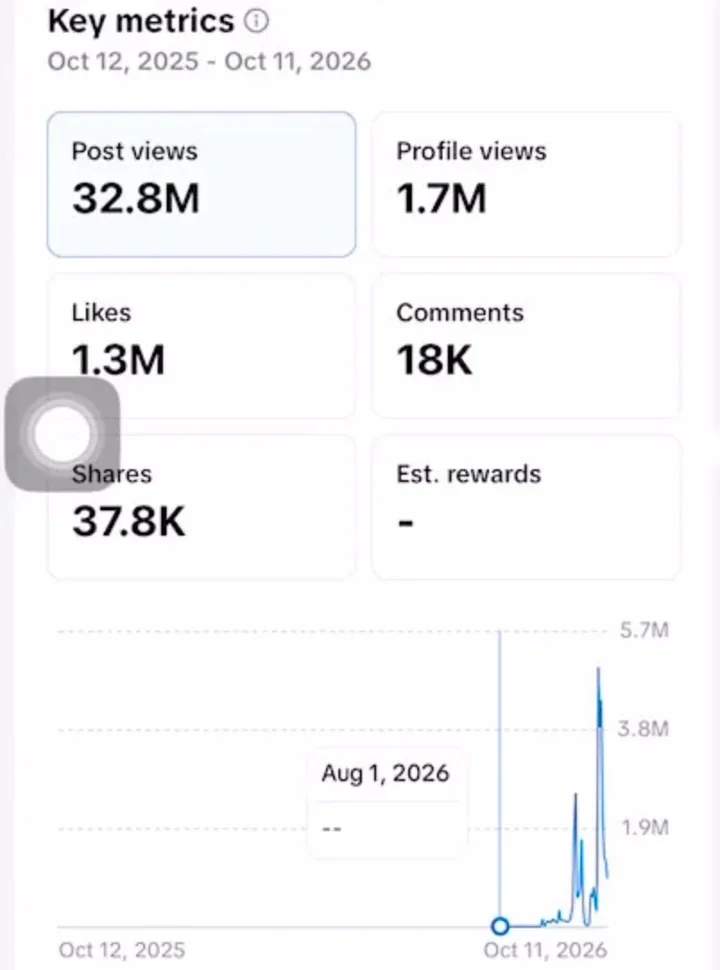
  • Daily views peaked close to 5 million in October, roughly two months after the account began gaining traction
  • 12-month totals: 32.8M post views, 1.7M profile views, 1.3M likes, 37.8K shares and 18K comments

What we did

  • Built original video concepts made for TikTok's For You feed
  • Engineered the hook and first second of every video to stop the scroll
  • Posted consistently and doubled down on the formats that started to break out

Screenshots from TikTok

TikTok Analytics, Oct 5 to Oct 11: 18.8M post views, 1.1M profile views, 640.6K likes, 6.9K comments, 18.4K shares
TikTok Analytics, Oct 12 2025 to Oct 11 2026: 32.8M post views, 1.7M profile views, 1.3M likes, 18K comments, 37.8K shares, with daily views spiking in October

Source: TikTok Analytics, Oct 5 – Oct 11 (7 days) and Oct 12, 2025 – Oct 11, 2026 (12 months)

205 million views in 60 days

Platform
Instagram
Timeframe
60 days (Jan 31 – Mar 31)
Services
Viral Content, Organic Growth
205.3M
Views in 60 days
64.5M
Accounts reached
+44.4%
Reach vs. previous 60 days
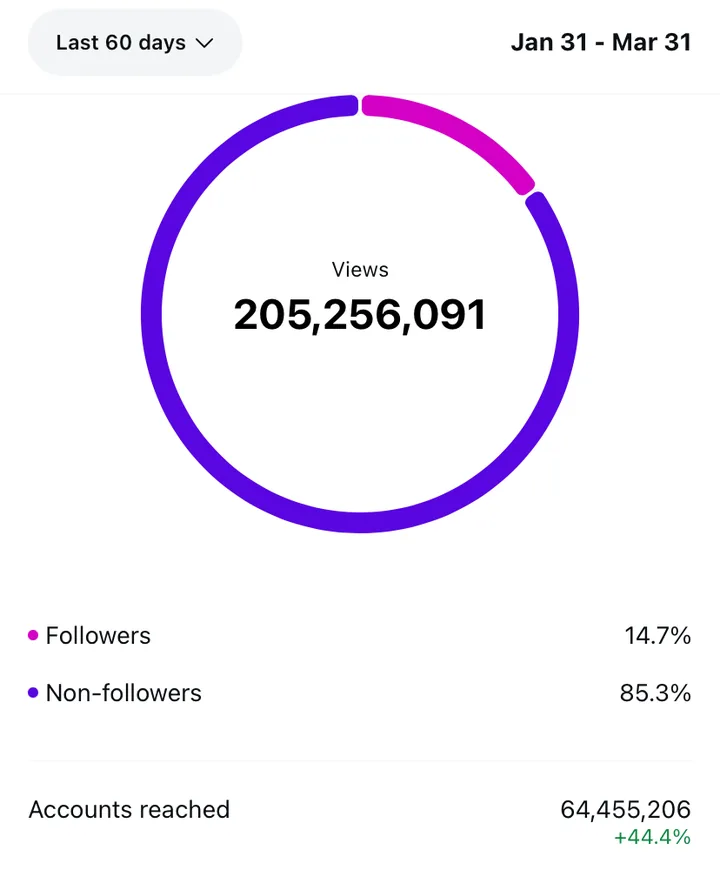
85.3%
Views from non-followers

The starting point

The account was already reaching about 44.6 million accounts every 60 days. The aim was to break through that ceiling with concepts big enough to travel far beyond the existing audience.

What the data shows

  • Reels drove 92.5% of views
  • 85.3% of views came from people who didn't follow yet
  • Reach grew from about 44.6M to 64.5M accounts

What we did

  • Developed unique video concepts built around the account's identity
  • Kept a Reels-first publishing rhythm across the full 60 days
  • Tested hooks and formats continuously and scaled the winners

Screenshots from Instagram

Instagram Insights: 205,256,091 views and 64,455,206 accounts reached, Jan 31 to Mar 31

Source: Instagram Insights, Jan 31 – Mar 31

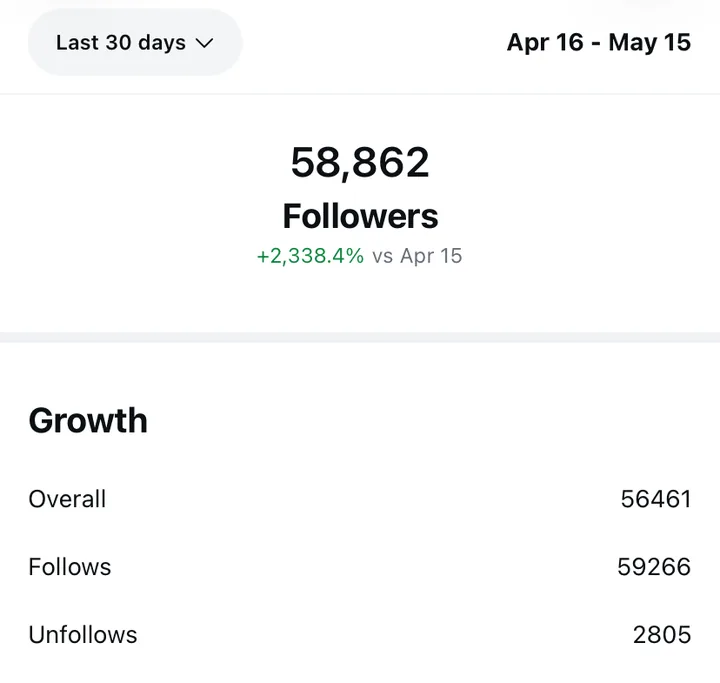
From 2,401 to 58,862 followers in 30 days

Platform
Instagram
Timeframe
30 days (Apr 16 – May 15)
Services
Organic Growth, Viral Content
+56,461
Net new followers
7.2M
Views
1.1M
Accounts reached, up 35,474%
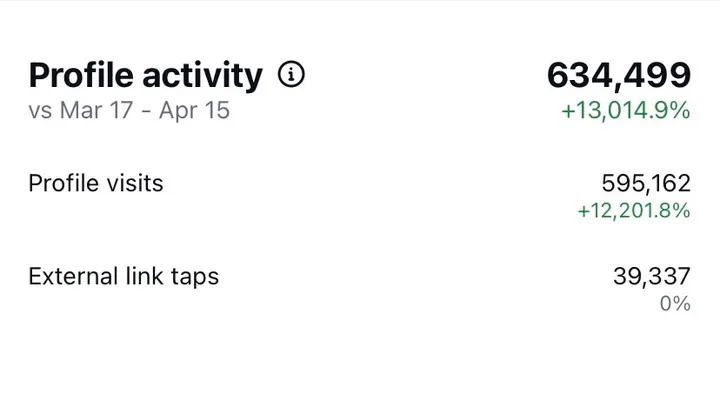
595K
Profile visits, up 12,202%

The starting point

The account had 2,401 followers and was reaching about 3,100 accounts a month, with fewer than 5,000 profile visits. Content was being seen almost only by people who already followed it.

What the data shows

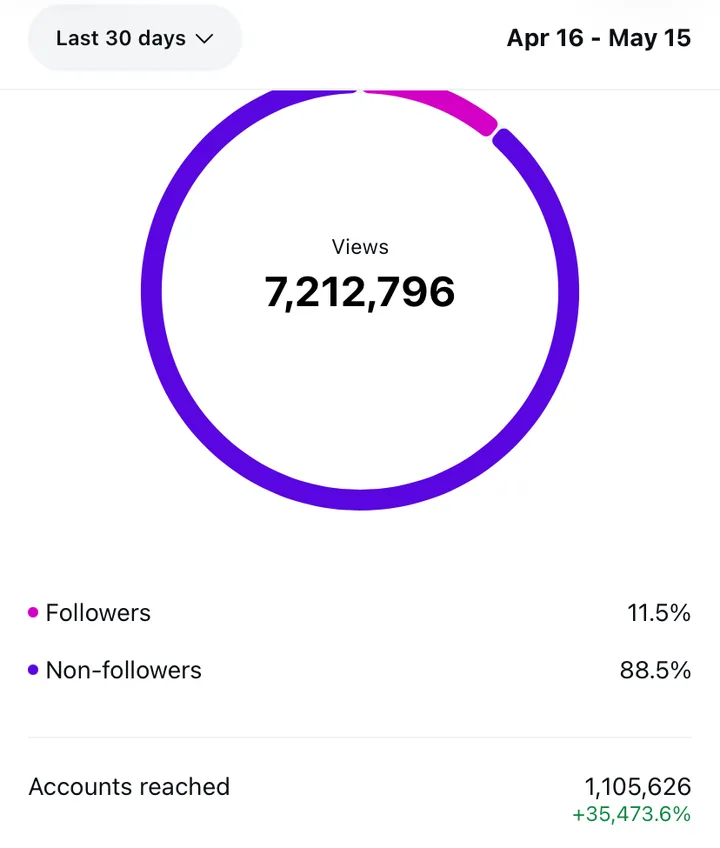
  • 88.5% of views came from people who didn't follow the account yet
  • Reels drove 82.4% of all views
  • 59,266 new follows against 2,805 unfollows
  • 39,337 taps on the profile link in a single month

What we did

  • Shifted the content mix to Reels built to be discovered by non-followers
  • Wrote hooks and formats for shares and saves rather than likes
  • Optimized the profile so new visitors had a clear reason to follow
  • Pointed the profile link at a single next step to turn attention into traffic

Screenshots from Instagram

Instagram Insights: 7,212,796 views and 1,105,626 accounts reached, Apr 16 to May 15
Instagram Insights: 58,862 followers, 59,266 follows and 2,805 unfollows
Instagram Insights: 595,162 profile visits and 39,337 external link taps

Source: Instagram Insights, Apr 16 – May 15

135 million views across three accounts in one month

Platform
Instagram
Timeframe
30 days (Mar 25 – Apr 23)
Services
Viral Content, Social Media Management
135.2M
Combined views
33.6M
Combined accounts reached
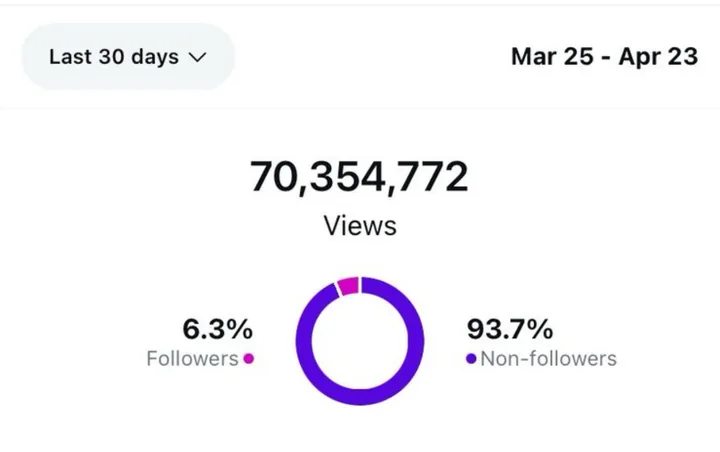
70.4M
Views on the lead account
+860%
Lead account reach vs. previous month

The starting point

Three accounts were managed side by side, each starting from a different place. The lead account reached about 1.8 million accounts in the previous month; the aim was to push all three further at the same time without the content going stale.

What the data shows

  • Lead account reach grew from about 1.8M to 17.0M accounts
  • Combined reach more than doubled, from about 14.9M to 33.6M
  • Reels drove 88% to 94% of views on every account
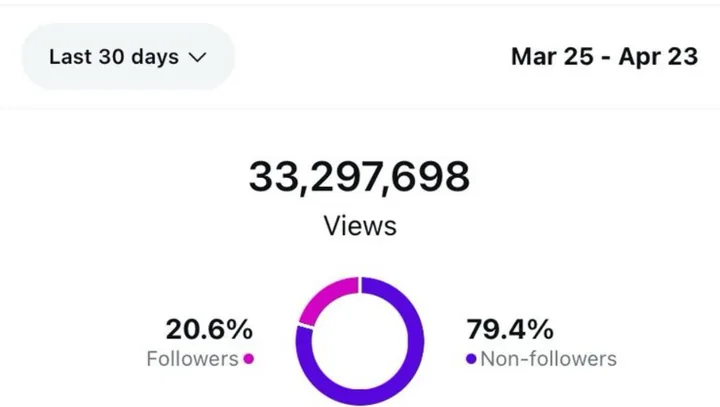
  • 79% to 94% of views came from non-followers

What we did

  • Ran a Reels-first plan on all three accounts in parallel
  • Tested hooks across accounts and rolled the winners out to the others
  • Kept Stories active to hold the attention of new followers

Screenshots from Instagram

Instagram Insights: 70,354,772 views, Mar 25 to Apr 23
Instagram Insights: 33,297,698 views, Mar 25 to Apr 23
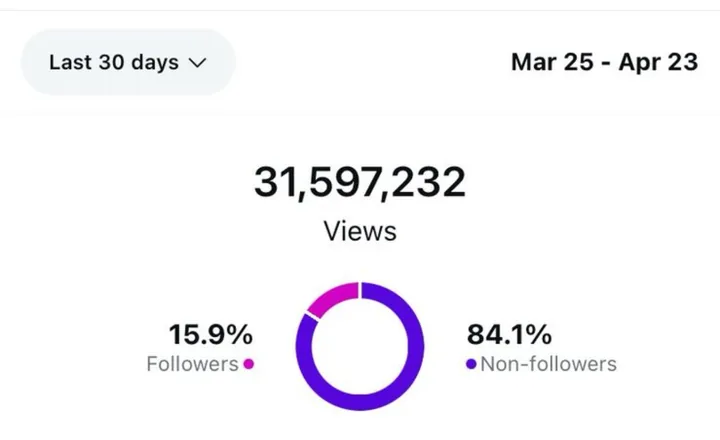
Instagram Insights: 31,597,232 views, Mar 25 to Apr 23

Source: Instagram Insights for each account, Mar 25 – Apr 23

Ready for reach you don't have to rent?

Tell us where you are and where you want to be. We'll come back with a straight answer on what organic can do for you, and what it can't.

Or write to hello@aeviralmarketing.com